:material-link: View in Colab :octicons-octoface: GitHub source
Getting Started
First install your.
!pip install git+https://github.com/devanshkv/your.git
Collecting git+https://github.com/devanshkv/your.git
  Cloning https://github.com/devanshkv/your.git to /tmp/pip-req-build-3lsl7ho_
  Running command git clone -q https://github.com/devanshkv/your.git /tmp/pip-req-build-3lsl7ho_
Requirement already satisfied (use --upgrade to upgrade): your==0.4.9 from git+https://github.com/devanshkv/your.git in /home/dagarwal/soft/conda/envs/numba_gpu/lib/python3.6/site-packages
Building wheels for collected packages: your
  Building wheel for your (setup.py) ... [?25ldone
[?25h  Created wheel for your: filename=your-0.4.9-py3-none-any.whl size=60606 sha256=51349937de1df5c25ddfd53c2afbdbd8aaaae06eb4c152ae3dcfec8365f92763
  Stored in directory: /tmp/pip-ephem-wheel-cache-vwwbzuag/wheels/af/ea/8e/0af2a86dd7ff7d8e91bf3e3d81d82853b1641f749d72144e32
Successfully built your
import your
Download and extract the a sample filterbank. Here we use the filterbanks containing FRB180417.
import logging
logging_format = '%(asctime)s - %(funcName)s -%(name)s - %(levelname)s - %(message)s'
logging.basicConfig(level=logging.INFO, format=logging_format)
import os
import tarfile
import tempfile
import pylab as plt
from urllib.request import urlretrieve
temp_dir = tempfile.TemporaryDirectory()
download_path = str(temp_dir.name) + '/askap_frb_180417.tgz'
url = 'http://astro.phys.wvu.edu/files/askap_frb_180417.tgz'
urlretrieve(url, download_path,)
frb_tar = tarfile.open(download_path)
frb_tar.extractall(path=os.path.dirname(download_path))
fil_file = temp_dir.name + '/28.fil'
We can now read the file using your as,
your_object = your.Your(fil_file)
Regardless of the file source, each your object has a unified header which can be accessed as follows. your_header displays all the attributes. These can be accessed as as your_object.your_header.attribute, e.g. to get the sampling interval use your_object.your_header.tsamp.
print(your_object.your_header)
Unified Header:
  "basename": "28"
  "bw": -336.0
  "center_freq": 1297.0
  "dec_deg": 13.9644755659
  "dtype": "uint8"
  "fch1": 1465.0
  "filelist": [
    "/tmp/tmp1uiuiwo7/28.fil"
  ]
  "filename": "/tmp/tmp1uiuiwo7/28.fil"
  "foff": -1.0
  "frequency_decimation_factor": 1
  "gb": 75.61933241312582
  "gl": 97.96004046706304
  "isfil": true
  "isfits": false
  "native_foff": -1.0
  "native_nchans": 336
  "native_nspectra": 5120.0
  "native_tsamp": 0.00126646875
  "nbits": 8
  "nchans": 336
  "npol": 1
  "nspectra": 5120.0
  "ra_deg": 186.656816998
  "source_name": "src1"
  "time_decimation_factor": 1
  "tsamp": 0.00126646875
  "tstart": 58682.620316710374
  "tstart_utc": "2019-07-18T14:53:15.364"
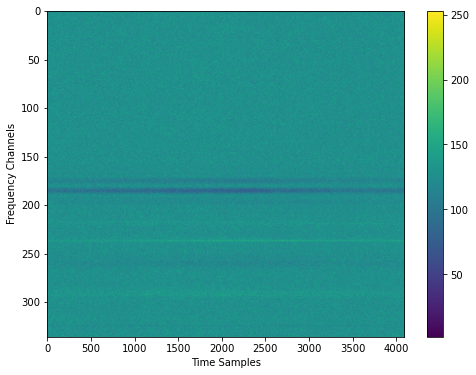
You can read the data in the file using the get_data method. The output is a numpy array with shape (nsamp, nchans).
data = your_object.get_data(nstart = 0, nsamp= 4096)
data.shape
(4096, 336)
And display the data!
plt.figure(figsize=(8,6))
plt.imshow(data.T, aspect='auto')
plt.xlabel("Time Samples")
plt.ylabel("Frequency Channels")
plt.colorbar()
<matplotlib.colorbar.Colorbar at 0x7f88b2538588>
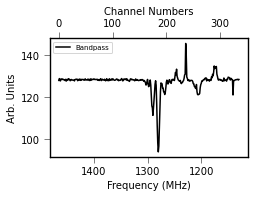
You can create the bandpass of the entire file or a few specific spectra by using your_object.bandpass
bandpass = your_object.bandpass()
2020-07-16 18:32:14,514 - bandpass -your.your - WARNING - This will read all the data in the RAM. Might be slow as well.
And plot and save the bandpass using the save_bandpass function from your.utils.plotter.
from your.utils.plotter import save_bandpass
save_bandpass(your_object, bandpass)
2020-07-16 18:32:15,114 - _findfont_cached -matplotlib.font_manager - WARNING - findfont: Font family ['serif'] not found. Falling back to DejaVu Sans.
2020-07-16 18:32:15,228 - _findfont_cached -matplotlib.font_manager - WARNING - findfont: Font family ['serif'] not found. Falling back to DejaVu Sans.